
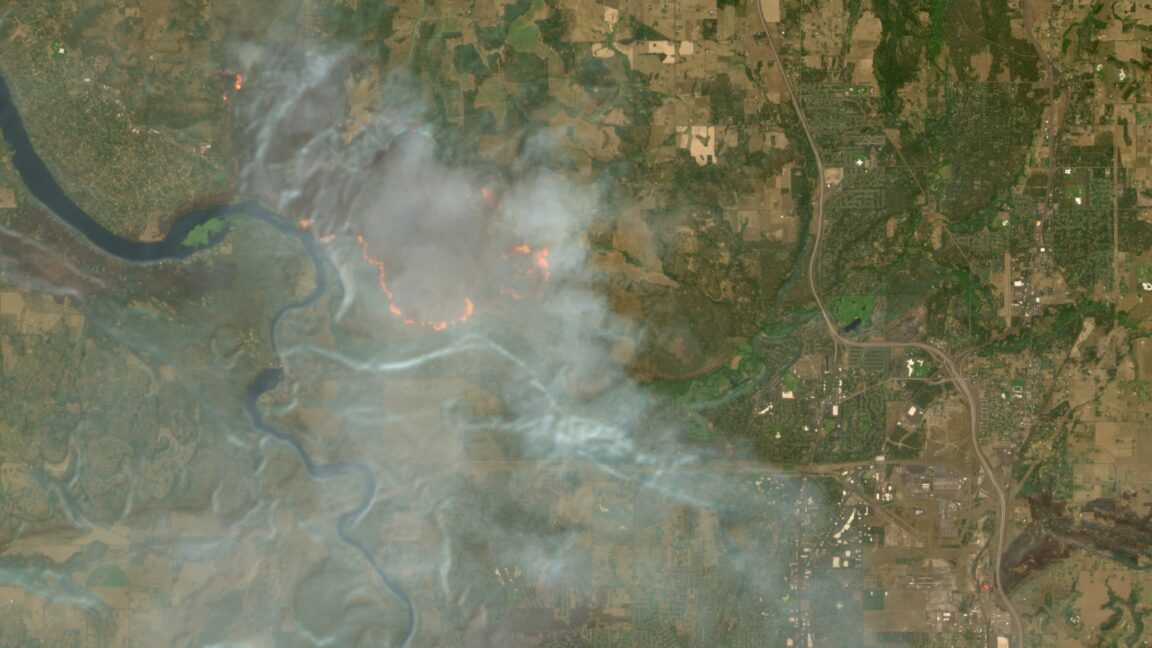
Europe's free satellite service just got wildfire visibility
Europe’s Copernicus program continues to broaden access to its vast archive of satellite data. The latest update centers on Copernicus Browser, a web-based interface that now includes a wildfire visualization layer. The feature comes as Europe faces a record wildfire season, and it aims to help the public and authorities understand where fires are burning and how they may evolve over time.
Unlike traditional, specialized tools, the browser-based visualization pulls in data from Copernicus sources and presents it in a more approachable format. The addition of a wildfire layer means viewers can see active perimeters, smoke plumes, and smoke-impacted areas in a single, interactive view. This is part of a broader effort to make environmental monitoring more accessible while leveraging the rich datasets generated by Sentinel satellites and related Copernicus feeds.
Ars Technica notes that the Copernicus Browser’s wildfire visualization arrives amid a record wildfire season, illustrating how public data portals are maturing into practical crisis-monitoring tools.
At its core, the update highlights two important trends in geospatial data access: openness and immediacy. Copernicus Browser provides a free pathway to environmental imagery that previously required specialized software and expertise. With wildfire visualization now integrated, users can quickly assess the spatial extent of fires, compare recent versus earlier conditions, and gauge potential exposure in nearby communities and landscapes.
What powers the new wildfire view
The visualization relies on data from the Copernicus program, including imagery from Sentinel satellites. These high-resolution datasets are repurposed within the browser to deliver a near real-time perspective on active fires and their progression. The goal is not to replace official firefighting dashboards, but to complement them with a publicly accessible layer that educators, researchers, and media can leverage for broader understanding.
- Public access to wildfire visuals without specialized software
- Web-based interface that lowers barriers to data exploration
- Sentinel-derived imagery powering the visualization
- Educational and media use opportunities to explain fire dynamics
In a time when environmental crises demand rapid information sharing, this move toward transparent, browser-based tools reflects a broader push within the European space program to turn satellite data into practical, everyday insights. For communities living near fire-prone regions, the ability to access a free, intuitive visualization tool can inform awareness, risk assessment, and conversation around preparedness. The Copernicus initiative continues to expand the reach of its data, reinforcing the idea that open access to imagery can elevate public understanding during critical events.
Looking ahead
As wildfires capture headlines during peak season, the Copernicus Browser wildfire visualization offers a tangible example of how open data infrastructures can evolve in response to real-world needs. While official agencies maintain detailed, authoritative dashboards, the new browser layer democratizes access to crucial situational information. This development underscores the value of combining free access with robust satellite imagery to enhance situational awareness across Europe and beyond.